Over the last couple of weeks, we have examined how we can debug our designs using Micrium’s μC/Probe (Post 1 and Post 2) or with the JTAG to AXI Bridge. However, the best way to minimize time spent debugging is to generate high quality designs in the first place. We can then focus on ensuring that the design functionality is as specified instead of hunting bugs.
To improve the quality of our design, there are several things we can do that help us achieve timing closure and identify design issues and bugs:
- Review code to ensure that it not only complies with coding and design standards and to catch functional issues earlier in the design stage.
- Ensure compliance with device/tool-chain-recommended coding standards—for example the Xilinx Ultrafast design methodology.
- Correctly constrain the design for clocks, multicycle, and false paths.
- Analyze CDCs (Clock Domain Crossings) to ensure that all CDCs are correctly handled.
- Perform detailed simulation to test corner cases and boundary conditions.
Over my career, I have spent many hours performing code reviews, checking designs for functionality, and for compliance with coding standards and tool-chain recommendations.
The Blue Pearl Visual Verification Suite is an EDA tool that automates design checking over a range of different customizable rule sets including basic rules, Xilinx Ultrafast design methodology rules, and DO254. The Blue Pearl tools also perform detailed analysis of clocks, counters, state machines, CDCs, paths, and constraints. All of this checking helps engineers gain a better understanding of the functional side of their design. In short, this is a very useful tool set to have in our tool box to improve design quality. Let’s look at how this tool integrates with the Xilinx Vivado design environment and how we can use it on a simple design.
With Blue Pearl installed, the first step is to integrate it with Vivado. To do this we use the Xilinx TCL Store to install the Blue Pearl Visual Verification Suite.
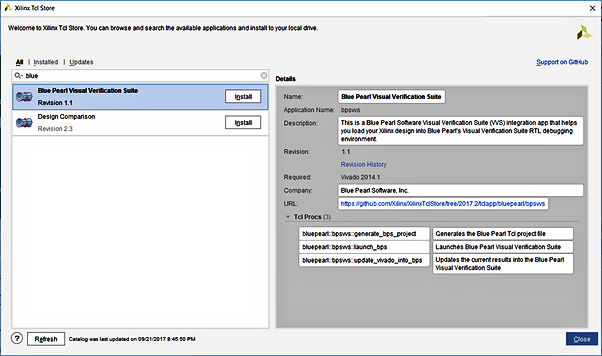
Installing Blue Pearl via the Xilinx TCL Store
Once Blue Pearl is installed, the next step is to create two custom commands. The first command allows us to open a new Blue Pearl project from an open Vivado project. The second command allows updates from Vivado into the Blue Pearl project.
We create these custom commands by selecting tools->custom commands->customizes commands.
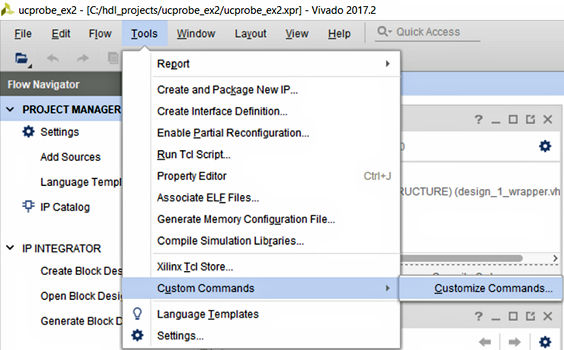
Open the Command Customization dialog
This opens a dialog that allows you to create custom commands. For each command, we need to define the callable TCL procedures in the Blue Pearl Visual Verification Suite.
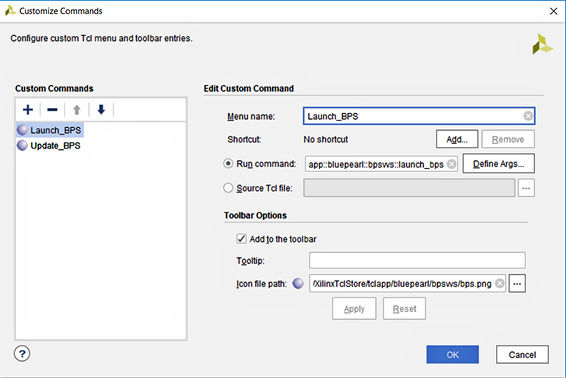
Creating the Launch BPS command
For the “launch BPS” command, we need to use the command:
::tclapp::bluepearl::bpsvvs::launch_bps
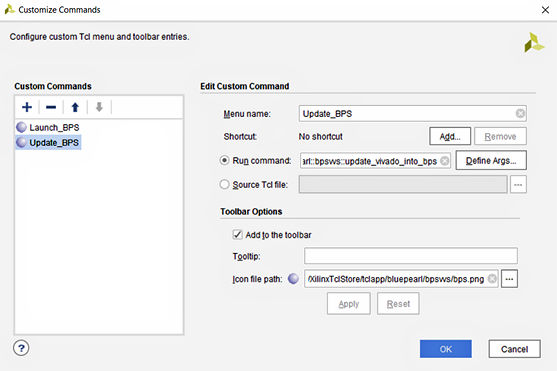
Creating the Update Command
For the update BPS command, we call the following command:
::tclapp::bluepearl::bpsvvs::update_vivado_into_bps
Once you have completed the addition of the customized commands, you will see two new buttons on the Vivado tool bar.
With the integration completed, we can now use Blue Pearl to analyze and improve the quality of our design if we identify issues that need analysis. Clicking the newly created “launch Blue Pearl” command within a Vivado project opens a new Blue Pearl project for analysis.
As it loads the Vivado design, Blue Pearl checks the code for synthesis and identifies any black boxes. Any syntax errors encountered will be flagged for correction before further analysis can be performed.
There are an extensive number of checks and analysis that can be run on the loaded design, ranging from basic checks to DO254 compliance. There are so many possible checklist items that it might take a little time to select the checks that are important to you. However, once you’ve specified the checks you want, you can save the rules and use them across multiple projects. What is interesting is the tool also reports if the check has been run and not just its status as pass of fail. This explicit feedback mechanism removes the ability of designers to achieve compliance by omission. (And that’s a good thing.)
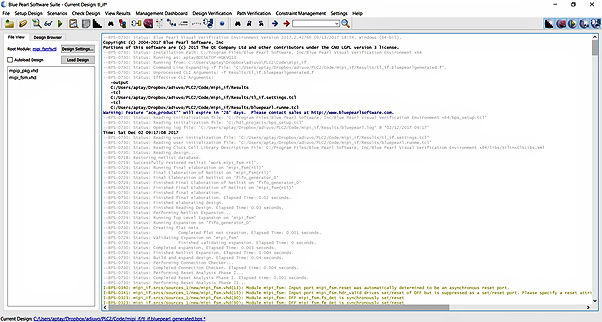
Blue Pearl Environment
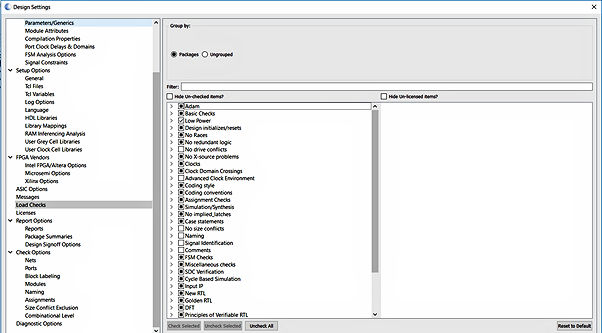
Design Check configuration
As an example, I loaded a project that I am working on to see what the design check and analysis reports look like. The design is simple. It decodes a MIPI stream to frame sync, line sync, and pixel values. While this is a simple design, Blue Pearl still identified a few issues within the code that need consideration to see if they present an issue or not.
The first potential issue identified was in the If/Then/Else (ITE) analysis. The design contains a VHDL process that decodes the MIPI header type. This process is written using an if / elsif structure, which implies a priority encoder. Furthermore, to differentiate between five different header commands, the length of the priority encoder contains a five deep if / elsif structure. Blue Pearl calls this a length of five. By default, Blue Pearl generates warnings on lengths greater than 3. In this case no priority required and a case statement would provide better synthesis results because there is no need to consider input priority. Although each application is different, you as the engineer need to use your own experience and knowledge of the design to decide whether or not priority is needed.
Along with reporting the length of the if structure, ITE analysis also analyzes the number of conditions within a statement. This is important when an if statement contains several conditions because additional conditions require additional logic resources and routing, which will impact our timing performance.
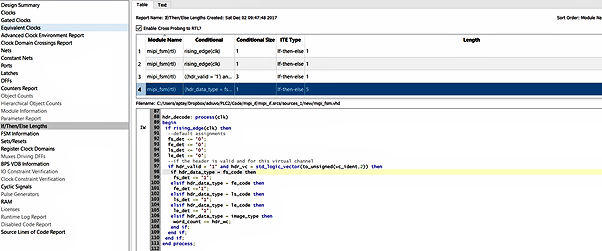
Identification of if / then /else large length
State machines are of course used in designs for control structures. Complex control structures requires large state machines, which can be difficult to follow in the RTL. As part of its analysis, Blue Pearl creates visualizations of state machines within a design. This visualization details the transitions among states, along with identifying any unreachable states. I found this capability very useful not only in debugging and verifying the behavior of my own state machines, but also for visualizing third-party designs. This graphical capability definitely helps me understand the designer’s intent.
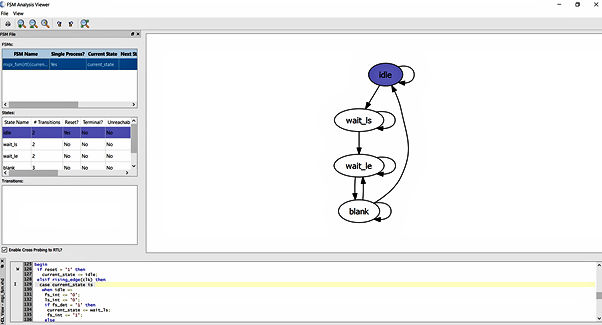
FSM Analysis Viewer
Blue Pearl also provides the ability to visualise CDCs and paths and to monitor fan out within a design. These features allow us to identify places in the design where we might want to add CDC-mitigation measures such as re-timing or pipeline registers within the design.
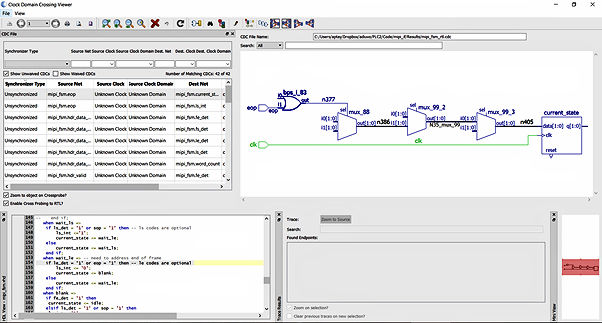
Clock Domain Crossing Analysis
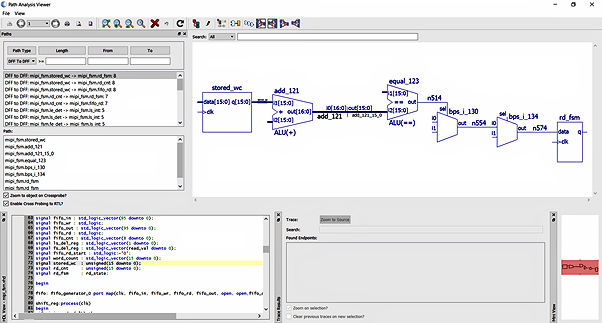
Path Analysis
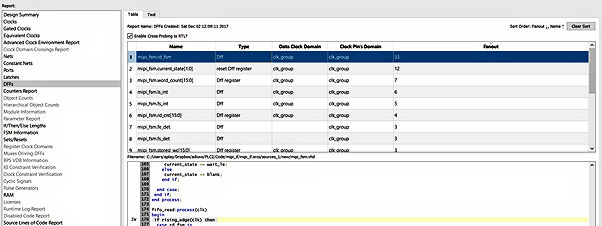
Flip-Flop Fan out reporting
Having touched lightly on the capabilities of Blue Pearl, I am impressed with the results once you have taken the time to set the correct checks and analysis. The analysis provided allows you to catch potential issues earlier in the design cycle, which should reduce the time spent in the lab hunting bugs. In turn, this frees us to spend more of our time testing functionality.
You can find the example source code on GitHub.
Adam Taylor’s Web site is http://adiuvoengineering.com/.
If you want E book or hardback versions of previous MicroZed chronicle blogs, you can get them below.
First Year E Book here
First Year Hardback here.

Second Year E Book here
Second Year Hardback here
