Introduction
 Today’s FPGA designs are typically developed by assembling between 50 to 100 unique IP blocks to form a complete System on Chip (SoC) including embedded processors, high speed serial interfaces, analog, signal processing and control logic. These systems are large, complex and partitioned into multiple clock domains and reset structures required to interface and control the various subsystem and reduce overall system level power. FPGA designers, developing these advance SoCs, must not only develop functionally correct RTL, they must also meet conditions for downstream interoperability within the overall system.
To reduce design risk and schedule slips, RTL code must be free of design errors, adhere to industry and corporate best practices, be free of dead code and unreachable finite state machine (FSM) states, in addition to having synchronized clock domains crossings to ensure metastability. Failure to use high reliability RTL can result in difficult and time consuming system level debug as well as design iterations late in the design process when iteration times are at their longest.
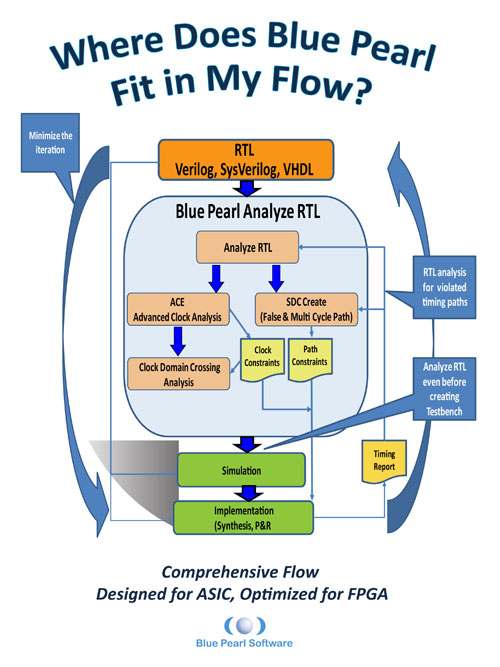
High reliability RTL is best achieved through a structured development environment that incorporates design automation for static design verification. While FPGA vendor supplied synthesis and place and route tools do identify many design rule violations, more sophisticated checks are needed earlier in the design processes. Two separate analysis environments are required; RTL Analysis for for bus contention, register conflicts, race conditions and CDC (clock domain crossing) analysis to identify asynchronous clock domains and their crossings.
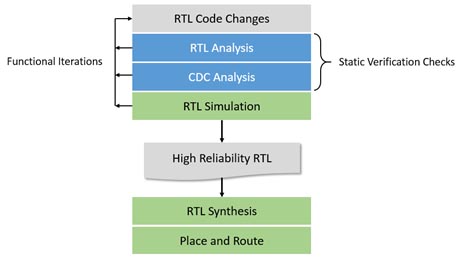
Without automation, finding and remedying design errors that affect interoperability turns into a random manual exercise. Automation enables an agile design process where developers continuously identify and address design errors while writing the RTL making it easier to develop, easier to test, and more reusable for future designs.
Blue Pearl Software
Blue Pearl Software, Inc. is a provider of design automation software for ASIC, FPGA and IP RTL verification. Its Analyze RTL™ linting and debug, Clock Domain Crossing analysis and Synopsys Design Constraints (SDC) generation solutions are proven to improve quality-of-results (QoR), reduce risk and decrease development time. The Visual Verification Environment complements RTL simulation solutions provided by EDA and FPGA vendors by ensuring code and SDC quality along with clocking integrity. Engineered to maximize RTL find/fix rates, the Visual Verification Suite uniquely provides easy setup, consistent results, Management Dashboard for complete push-button analytics, and runs on both Linux and Windows.
RTL Analysis with Lint Checking, Formal Verification and X-Propagation
Analyze RTL incorporates a suite of technologies into a single RTL analysis environment to help developers find bugs earlier in the design processes. Super-lint tools are combined with the power of formal verification to provide a single, high capacity design checking environment that identifies poor coding styles, improper clocks, simulation and synthesis problems, poor testability and other source code issues. FSM analysis automatically extracts and analyzes finite state machines for dead or terminal states and provides a visual representation. X-propagation analysis will detect unknown states, often introduced into designs to implement soft resets or to implement power management schemes that are masked during RTL simulation.
Clock Domain Crossing Analysis with Grey Cell Technology
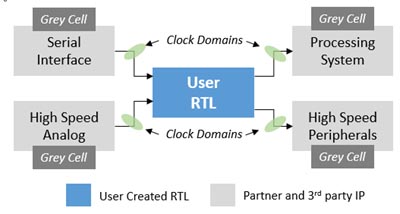
Blue Pearl delivers the industries most advanced clock domain crossing analysis that incorporates over a decade of experience to find errors other tools fail to identify. Analyzing RTL for a single block of a system in isolation is not sufficient to detect all CDC violations but rather the entire system must be considered and analyzed to perform a thorough CDC analysis. However, this can be a challenge when using 3rd party encrypted IP. Blue Pearl addresses this challenge using a patented technology called “Grey Cell” that enables a representation of a protected IP block for CDC analysis of module-to-module connections while preserving the trade secrets of the original IP provider.
Architected for Ease of Use Ensures Fastest Bug Find/Fix Rate.
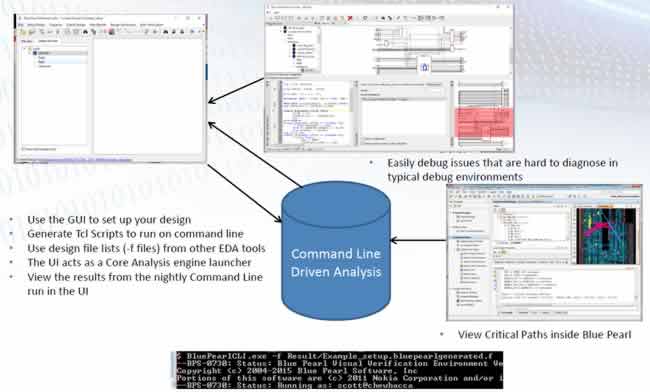
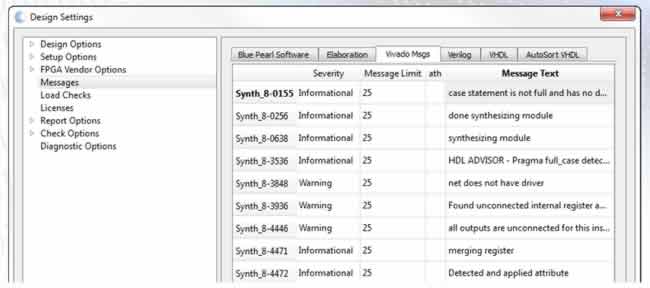
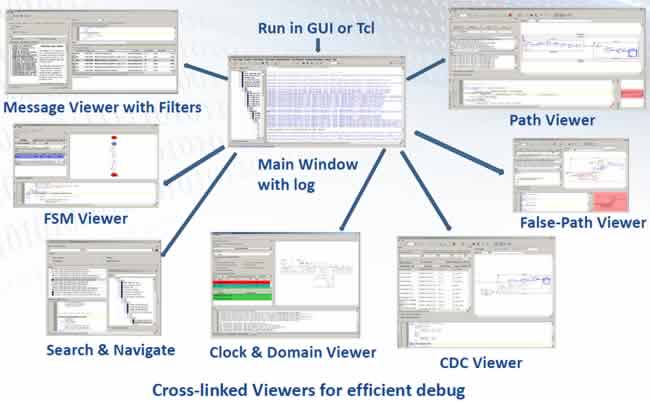
Even the best static verification technology can be severely hampered by poor usability as potentially thousands of errors may be detected and flagged to the user for resolution. The Visual Verification Environment addresses the static verification usability problem in three key ways. First it includes a graphical user interface that incorporates state of the art EDA “ease-of-use” concepts that is proven to make new users productive in under 2 days. Tool options and settings are progressively displayed to the user with quick links to documentation. Second, a powerful set of message filters have been developed that lets users quickly identify only those messages that need attention. Design teams can focus on issues requiring direct attention and not be distracted by items of limited or no importance. And third, the environment provides a schematic view of the RTL with cross probing back to the warning or error message and RTL source code that lets users quickly understand and resolve each message that requires attention.
Industries only Static Verification Tool Optimized for FPGAs
Blue Pearl offers the only static verification environment optimized for the unique requirements of FPGA design. These checks include analyze for routing congestion, reset configurations and even estimate critical timing paths prior to synthesis. Grey Cell modeling supports the analysis of FPGA vendor provided protected IP cores with asynchronous clock domains. The Visual Verification Suite supports both Xilinx Vivado® Design Suite with built in UltraFast™ Design Methodology design rules and Altera’s Quartus® Prime Design Software and is the only static verification environment that runs on Windows – the preferred FPGA environment.
Summary
The Blue Pearl Visual Verification Suite enables developers to turn functionally correct RTL into high reliability RTL that supports interoperability into IP based system designs. Over a decade of experience is incorporated into industry leading technology that is uniquely optimized for the ease of use with the fastest bug find / fix rate and provides design rules checks required for FPGA design. For more information, please visit www.bluepearlsoftware.com to download an evaluation today.

 Working with ASIC and particularly FPGA designers, I’m frequently asked if finding bugs using existing simulation or emulation tools is sufficient. The short answer is “Yes”,but it’s not always the most efficient. As design sizes increase but schedules do not expand to match, designers find themselves frustrated by spending too much time looking at simulation results or on bench testing to find bugs. Recently a mil aerospace customer lamented that, aside from enduring the process of re-planning and resetting schedules, and the risk of having a project cancelled for being 2+ weeks late, it’s very embarrassing to explain to management that the mistake turned out to be just some unconnected nets that could easily have been found by a lint tool in mere minutes.